
Your API gateway is dropping packets, and you are trying to deduce why the gateway is suffering from packet loss or if the balancer is not routing traffic — or maybe your client cant even send out the requests. All you do know is that you are losing around 30% of critical user data that serves user experience, your data pipeline, and revenue calculation. Losing data is Defcon 1 for many companies, and in our case, it crippled our new project’s ability to record user actions and map those actions across our products. Unable to find the root cause and ship a working version is a common and ever-looming threat to a live services team that requires persistent, low latency, and high-scale backend services.
The question comes down to is where the fault. This is where we need eyes to be extended to metrics invisible to product leaders and developers. The product leader’s vision is often placed on essential engagement and monetization metrics — let’s say time in-app, the north star metric, and retention. While the developers and cloud ops might be looking at latency, requests per second, and error codes. However, these all do not represent the complexities of live service products. What a product leader needs to consider is the hidden metrics that are seldom seen. That is where observability comes in.
Observability is the process of viewing all of the requests/responses in a live product, with particular attention paid to the health of these services. Observability focuses on collecting, monitoring, and analyzing the services.
This post will explore what observability aims to provide for a live services team, why we (product leaders) need observability, and how seeing hidden metrics helps maximize feature performance and minimize the guessing work in failures. The goal is to show what are the baseline metrics to monitor to gauge the health of live services, and why the product team traditionally is not interested in CPU usage, package loss, or container health. focusing on user experience is the backbone of product, but missing out on the tech component is where live services product will fail.
I aim to show that observability is not only the domain of tech and product needs to pay attention to observability to construct SLOs (Service Level Objectives), alerts, and automate operations to ensure the tech matches product strategy and enhances— the user experience.
TL;DR
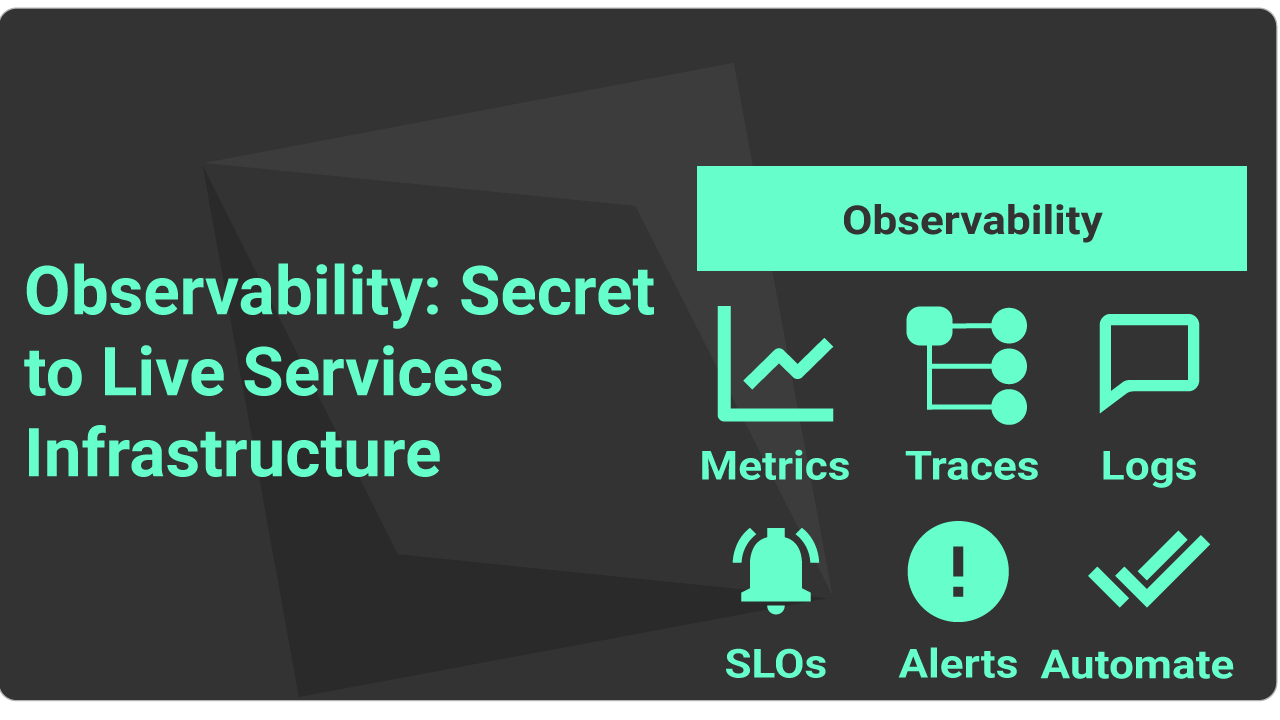
- Observability is the process of making client and server health visible by creating detailed measurements of performance, tracing the flow of data from user to storage, and discovering problems as they happen with great flexibility.
- Metrics
- Logs
- Traces
- Developers, SRE teams, and security teams are the traditional owners of observability infrastructure, but this needs to be broadened to the scope of the product.
- Developers look at the application made by your company and often try to debug or understand hiccups in usability.
- SRE teams look at the containers your app is running in, Database usage, and other jobs/processes handled by platforms such as GCP (Google Cloud Platform) or AWS (Amazon Web Services).
- We need to include product leaders in the scope of observability, so companies treat each request and response as a user action. What is the user experiencing — is the experience acceptable from a product perspective?
- Observability is holistic, the setup requires heavily defining the metrics you are looking at, and if they are well defined, you can quickly determine why your product metrics are slumping.
- Address methods to automate, scale, and distribute the load.
- Address critical bugs only discovered in production.
- Hotfix web-based live services and re-release client fixes ASAP.
What is Live Services Infrastructure?
Just to give you a quick definition of live services in gaming and product. Live services are commonly referenced in the gaming ecosystem. Live services are focusing on streams of regularly delivered, well-maintained content and usability. Cases such as Fortnite, Valorant, World of Warcraft Final Fantasy, Clash of Clans, Call of Duty Mobile are all excellent examples of live services. These products have consistent work done, extensive cloud services, and dedicated Live Operations to build out new features and ensure that their products are performing as expected. A very famous example is the virtual concerts in Fortnite as a key live services event. However, let’s not limit live services to just the gaming ecosystem. SAAS (software as a service) is the new medium with a heavy focus on IAP in all mobile apps and moving towards high bookings and consistent revenue from subscriptions. Most if not all well-designed and operated products are becoming live services with immense cloud infrastructure.
What is Observability?
Observability is the process of seeing what a system is doing and determining why that system is doing that. Most commonly used for detecting errors or differences in trends in a system, i.e., we can catch when a system is not behaving normally. We are trying to follow the inputs throughout the lifecycle of this request and view the outputs. Observability is used in DevOps teams to keep systems operable, maintainable and allowing for future scaling.
An essential function of observability is that it enables engineers to ask questions that they never anticipated and automate responses like scaling out compute units. But even more so and not often considered in this scope is that it allows product leaders to flag issues in delivering the product to the users. Let’s dig into what an observability provider bases its platform operations on.
Metrics
Metrics are some of the longest-standing methods for observing a distributed system’s health and product as a whole — if you have seen a dashboard, you have witnessed metrics. Metrics consist of aggregate type counters that compute rates, gauges that display values, and distribution that shows your data’s heatmaps or variance. one of the more common metrics that live service providers pay attention to is requests per second (RPS). This metric and its associated params give developers an indicator of the scale of service usage by users.
Metrics are not the complete picture of users, similar to how events are closer, but still do not capture a concrete set of actions. Metrics allow us to aggregate average and identifier outliers and scope into specific endpoints spouting errors or causing requests followed by slow response times.
Logs
These are structure request logs and debug logs commonly delivered in JSON. Request logs include various metadata such as IP address of the sender, timestamp, id of the process, request URL, a response code, user agent, and request-id. Putting it plainly, it just includes information to tell where it is coming from and what happened. Another case is debugging logs, which tell engineers what went wrong, including much information and detailed warning errors.
There are three primary sources of records. OS is a pretty basic log created by the OS developers to standardize information on usage, activity, and processes on a system. This often comes down to pulling various device telemetry data and attributing faults to the specific clients — edge cases. Another logging scenario is monitoring Kubernetes, elastic container service, or Azure Containers allows you to monitor VM clusters and the health of your systems on that end — high ability to detect when workers collapse and redistribute that compute load is critical to know.
The most important telemetry data can be your app data — you need to spend some time creating a proper event scheme — put in good work on the application side to ensure that the data going out is consistent and well detailed to make inferences of the root cause. Your app might consist of a frontend system, that communicates to a backend, and has a data processing component, all of which read, write, update, delete (CRUD) into a single database or multiple. All of these services would require their own infrastructure to monitor their performance. These are made specifically by your developer and need to be well implemented with associated error codes and detailed debugging information. If you want more information on the fundamentals of architecture design check out my previous post on systems architecture.
Traces
It is tough to see how a system works before production. Even when you create a unit test and it passes all of the test cases. When you implement the system into the product and release it to production, you cannot predict its performance.
Traces allow you to break down the lifecycle of individual transactions. A fundamental trace component is a span, a trace waterfall where we can analyze various methods. You can think of them as repositories or lines of code run sequentially. A span represents a single unit of work done by a service.
Each trace is one transaction between services, one per span, contains several key pieces of data: so if we look at a trace, we might see a list of transactions that can consist of these core fields. An ID is the ID of transaction Request/response to identifying this transaction compared to all traffic running through these services. The PID, on the other hand, represents the previous step in the trace (i.e., the PID of B is A). We can also get pieces of data, such as the start time and end time of that particular method.
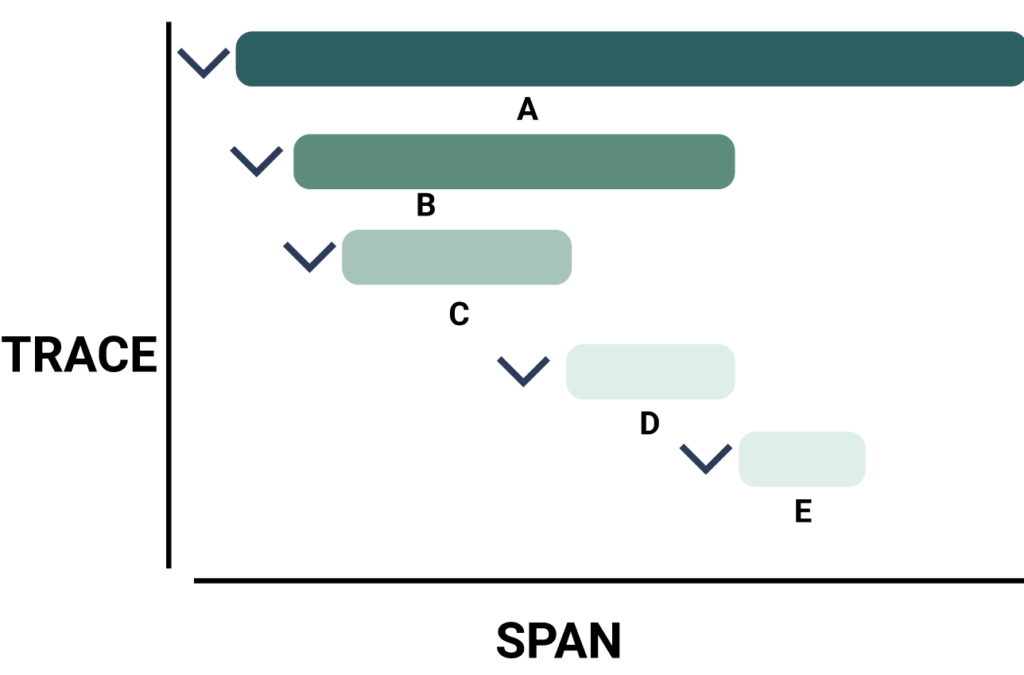
Example of a trace and its spans
We not only can use spans for services, but we can also look at each function or method along a pipeline. Allowing to have fantastic fault detection on any one of those services.
Why Do We Need Observability?
Before we dig down into a specific case, let’s first look at three core users of an observability platform. Observability platforms aim to aggregate all cloud, on-prem, and client data to allow for each of these specific users to address issues in their scope of work. All tech products have drastically changed in the last 20 years, and especially Let’s quickly look at the traditional scope of observability.
Developers, SRE, SecOps
Developers in the case of observability are interested in seeing specific debug logs for the app performance. They want to see the individual performance of the client app itself — they are not searching directly for Kubernetes performance, database CRUD, or operating system metrics.
So going back to the example, we need to know how the system failed. We could not predict how in this case, we will not know if it is a hegemonic crash that takes down a whole microservice and has cascading consequences to other services. We do not know if we just won’t receive data or if the service blew up and the users got 400 errors or timeouts. The goal of observability is first to detect story points and construct a narrative of your system and its performance.
Beyond that of a developer’s scope of work, we also need to satisfy the site reliability teams; they would need to monitor the Kubernetes clusters, database write, scaling performance, and various other cloud resources to allow for dynamic scaling based on the stress to the system. They require a dashboard that focuses on the health of Kubernetes, database resources, cronjobs, etc. they are focusing on whether or not their cloud infrastructure can scale to the demand from the app. Meanwhile, a security team might be looking at threats from their security tool and look deeply into a specific user id so they can identify unusual traffic and potential threats.
The value of observing all live service requests/responses is that you can get an exact snapshot of what a user is doing by using high cardinality data. That means we can track user actions in the apps via events and user ids. These platforms allow users to set SLOs (service level objectives) with specific durations or targets. We can have an API latency set to 1100 duration_MS for a highly performant web service. This means that we will record any duration > 1100 milliseconds outside of the everyday operations and break our service level agreement (SLA). Another case is we could have a threshold of failed requests for a highly reliant web service.
The Product Side
Now, let’s break away from tradition. Product is obsessed with user metrics, shipped features, and significant engagement, monetization, and retention impacts. We need a case study when we apply these observability principles, especially to a live service product. Dead by Daylight is a coop survival game where players are being hunted by a famous horror villain (also played by a player). This game is a live service game full of fast-paced action requiring low input lag on the player side.
The developers of Dead by Daylight decided to implement an observability platform called Honeycomb and were able to quickly discover that one of their servers was lagging. This allowed them to address the issue and keep players in the product with a good experience. While this problem was solved by developers. The engineers and product leaders knew that the user experience was suffering due to every time a user logged in via a gaming platform, Dead by Daylight has to call that platform to get the player info for that user and the infrastructure was snagging and unable to fulfill responses due to hitting a hardware limit that prevented the OS from opening any more sockets—preventing the user from playing.” This probably was first identified from user metrics, monitoring logs, or user feedback. All of these avenues allow product leaders, engineers, and customer representatives to orchestrate a more reliable product service.
Another fantastic case study is Riot’s decision to move to internal servers and new infrastructure to enable lower latency for players. They knew the highest value to the players of League Of Legends and all of their future products like Valorant are low latency so they built out a strong server infrastructure and actually run all of their live services on that same infrastructure. They have as a result mastered the competitive e-sport scene and also have a strong place in the live services industry.
How We Implemented Observability
This will not be a productive nor maximized post if I list out all of the observability platforms. Many of these observability platforms, APM monitoring, logging, or tracing companies, have a good reputation and work well, significantly if we limit the use cases of observability to only the domain of tech.
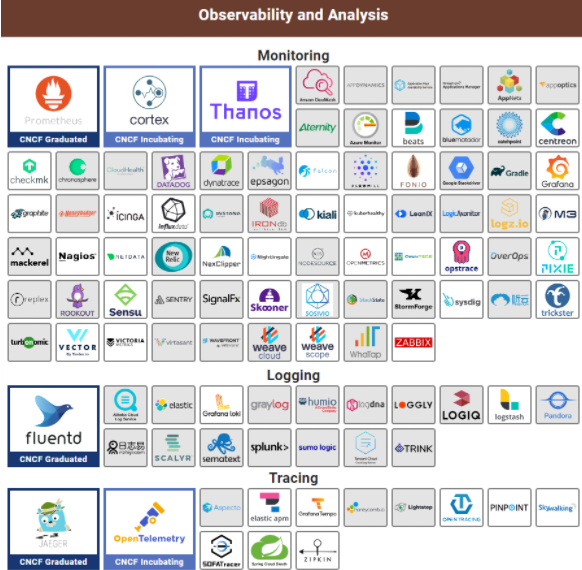
There are just too many platforms, and I cannot advise without explicit requirements.
Generally, most companies fall into a service provider camp, be it AWS, GCP Azure, etc., all of these companies have an APM solution. That being said, not all of these products will be able to provide you with full observability.
For our use cases, we monitor simple system metrics for each response or request, such as internal product versions, frameworks, and framework versions. We are sampling only 1% of our 1.4 million RPS for our testing data. This small sample rate allows us to keep costs down while also receiving enough data to eliminate some false positives or false negatives that might emerge due to a small user count. While also paying attention to outliers with the underperforming regions, request types, and latency.
This service is used to send every core product event to our data pipeline (Client, server, storage) to observe the entire trigger logic, data collection, and ETL process. This allows product leaders to not only look at high-level product performance metrics but high cardinality data such as region-related performance, network reachability of devices, and the total latency of a transaction. It also allows product leaders to think if the goal is fault tolerance — meaning the user never detects a failure in an instance or is it about high availability, meaning that a user might be queued to access a service and fail.
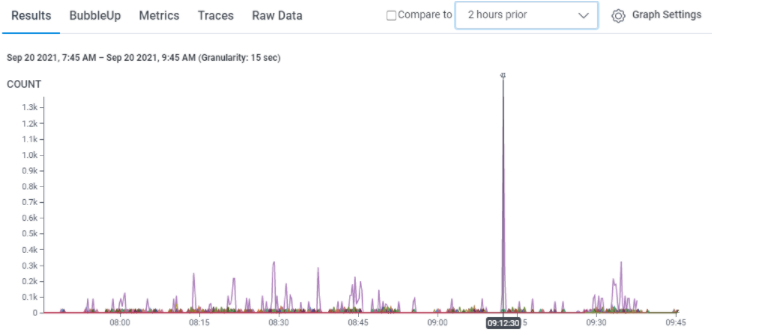
Example staging data for one of our services
You can see that each of these peaks represents a metric, in this case, an event and the count of events sent in the last two-hour period. As you might notice, we have a significant spike in event counts from one specific event, so we can dig down into what is causing that error as a product leader or developer.
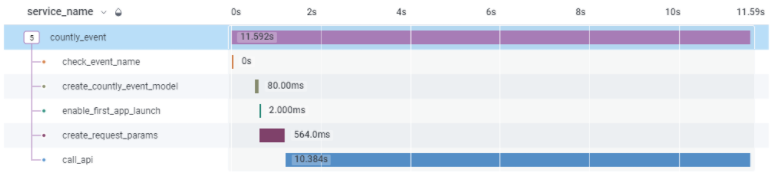
One trace for one of our dev services showing the entire life of one request
You can see that the call_API function caused a timeout and probably led to a terrible user experience. So for us, the following steps are reading into the error codes generated by that call_api function and deploy a hotfix on the server-side to rectify that issue. We are trying to achieve end-to-end; even in this trace, we are still missing some critical components of the ETL process to ensure this service’s core goals of atomicity, consistency, and all at low latency — while being scalable. It sounds harsh but going well so far.
With us being able to detect the problem, our next step is automating the response. That is quickly done through observability; this timeout generates an alert that sparks an automated process to deal with it. The power on the dev-side allows us to detect the onset of failures and pump out new instances.
With observability, products become better. Observability is part of the foundation of a tech stack and should not be considered further down the road. Start early, detect early, and fix it before your core metrics flatline.
Building Moments:
Returning to the United States after three years abroad, working and traveling the world is bitter-sweet. I am patiently waiting for my next international adventure.